What're you telling me, Ghidra?
An introduction to Ghidra's primary components
Acclimating to a new reverse engineering platform for the first time is a daunting experience. It’s information overload. What am I supposed to be looking at? What are all of these windows trying to tell me? How do they relate to one another? What levers do I have to play with? With enough experience, answers naturally emerge. But before this intuition builds, a clear starting point is needed.
I first reached for YouTube, studying the workflows that reverse engineers like LiveOverflow used when exploring binaries. Watching videos was not enough, however. I had to play around for myself.
I fired up Ghidra (an open source reverse engineering suite, courtesy of the NSA), loaded a simple C binary, and was greeted with the listing view. It was impossible to ignore all the colors competing for my attention. I had to know what they meant. I opened Ghidra’s built in help content (Help -> Contents), but I didn’t know what to search for. How could I know what concept each color related to?

So I tried a different approach.
I went into Edit -> Tool Options, and set color as my filter. This showed me all configurable colors across the many available windows. This gave me two valuable tools:
- For each window, every configurable color was listed. They had labels like “Off-Cut Cross Reference,” “Function Call-Fixup,” and “Custom Storage Parameter.” From this, I could search help content more precisely for concepts I wasn’t familiar with. This was instrumental in learning Ghidra’s vocabulary.
- Default colors were displayed, which let me identify elements at a glance. If elements were still hard to find, I would change the color to something maximizing contrast and then scroll through the binary listing, looking for the new color.
This post is a summary of what I’ve picked up over the last couple of months reverse engineering binaries and competing in CTFs. My goal is to help you build an understanding of Ghidra’s primary components as you take your first steps with Ghidra, with the hope that you’ll choose to dive deeper and teach me what you learn 😉
Listing
Most of my time spent is within the listing view. I’m willing to bet your experience will be the same. It’s the main window by default, offering Ghidra’s disassembly of the loaded binary. Ghidra’s analyzers will populate this window with what they uncover. This provides a solid foundation, where you can pickup and continue your reverse engineering project.
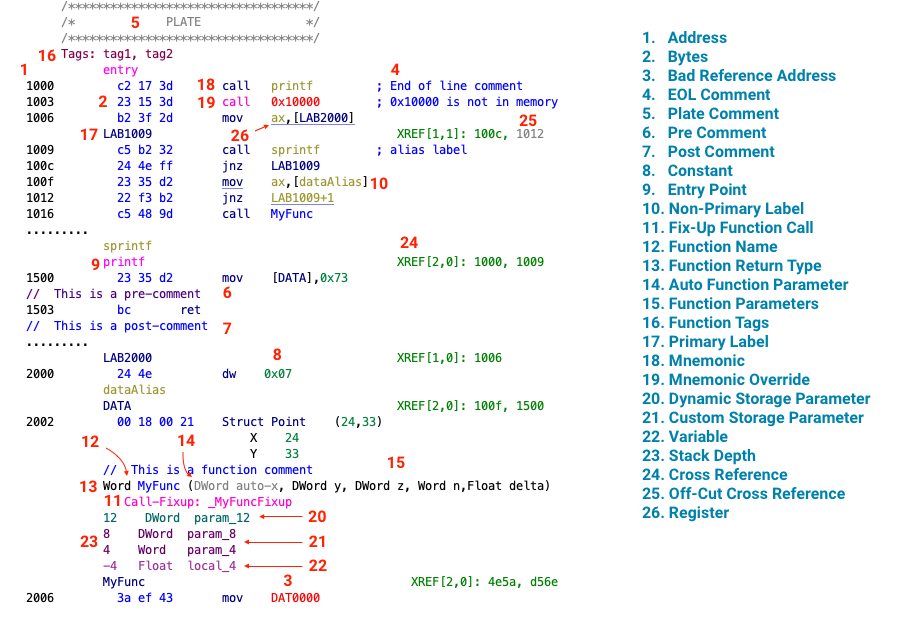
Address - Virtual memory address of the first byte for the decoded instruction.
Bytes - Raw bytes which were disassembled to produce the decoded instruction.
Bad Reference Address - Instruction referencing an unmapped memory address.
End of Line Comment - Self explanatory.
Plate Comment - Comment centered within an added border. Typically used to highlight functions and well known data structures within a binary.
Pre Comment - Self explanatory.
Post Comment - Self explanatory.
Constant - Literals such as numeric values or strings.
Entry Point - First instruction within a function.
Non-Primary Label - An additional label added to a memory location. For example, if one function is an alias for another, the alias will be represented as a non-primary label
Fix-Up Function Call - Some functions modify control flow in non-standard ways. For example, binaries compiled with Control Flow Guard have built in security checks that are performed before execution is passed to the called function. To aide Ghidra in understanding these side-effects, some function calls are inlined. At the call site, P-code is substituted for the function call. In the listing, Ghidra indicates which Call-Fixup is applied.
Function Name - Self explanatory.
Function Return Type - Self explanatory.
Auto Function Parameter - Parameter that is implicitly passed or returned as required by the calling convention. For example, the
thispointer that’s passed as part of C++ member function calls is an auto parameter. Return values are also auto parameters.Function Parameters - Typical function parameters passed as part of a function call.
Function Tags - Lists the user defined tags attached to a function.
Primary Label - Label used when references are made to this memory location, function, or symbol.
Mnemonic - Friendly name for the decoded instruction.
Mnemonic Override - Manual override mnemonic selected for the decoded instruction.
Dynamic Storage Parameter - Parameter storage determined by the function’s calling convention.
Custom Storage Parameter - Parameter storage defined by the user. Can be a combination of stack, register, or memory locations.
Variable - A local or global storage location with an associated name and data type.
Stack Depth - Tracks where each parameter exists in relation to the stack frame.
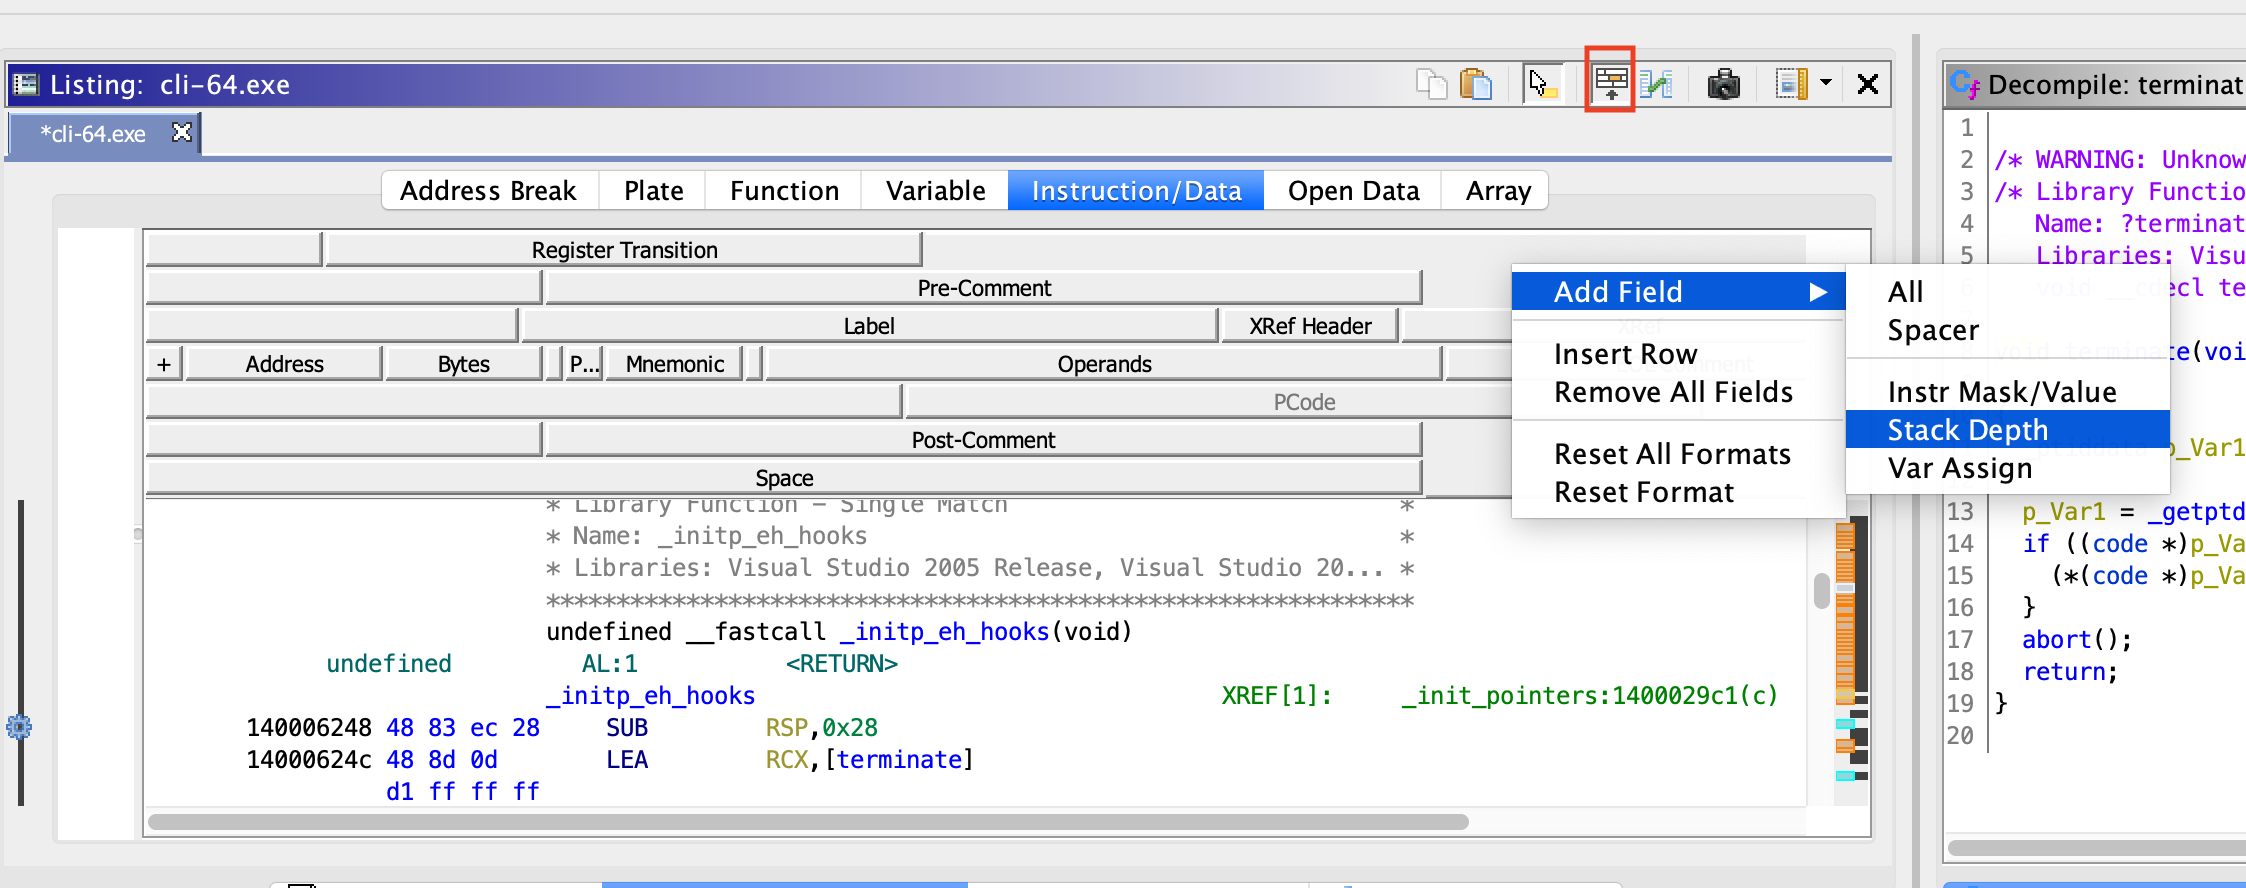
Stack Depth can be added as a listing field, tracking how each instruction in a function modifies the stack frame.
Cross Reference - Data or instruction referencing other data or instruction addresses.
Off-Cut Cross Reference - Instruction referencing other data or instruction by using an offset added to a base address.
Register - Self explanatory.
Cross References
Cross references are instructions or data that reference other data or instruction via memory address. In addition to showing the raw address reference, Ghidra adds context. It specifies whether the reference is part of a read, write, or other operation.
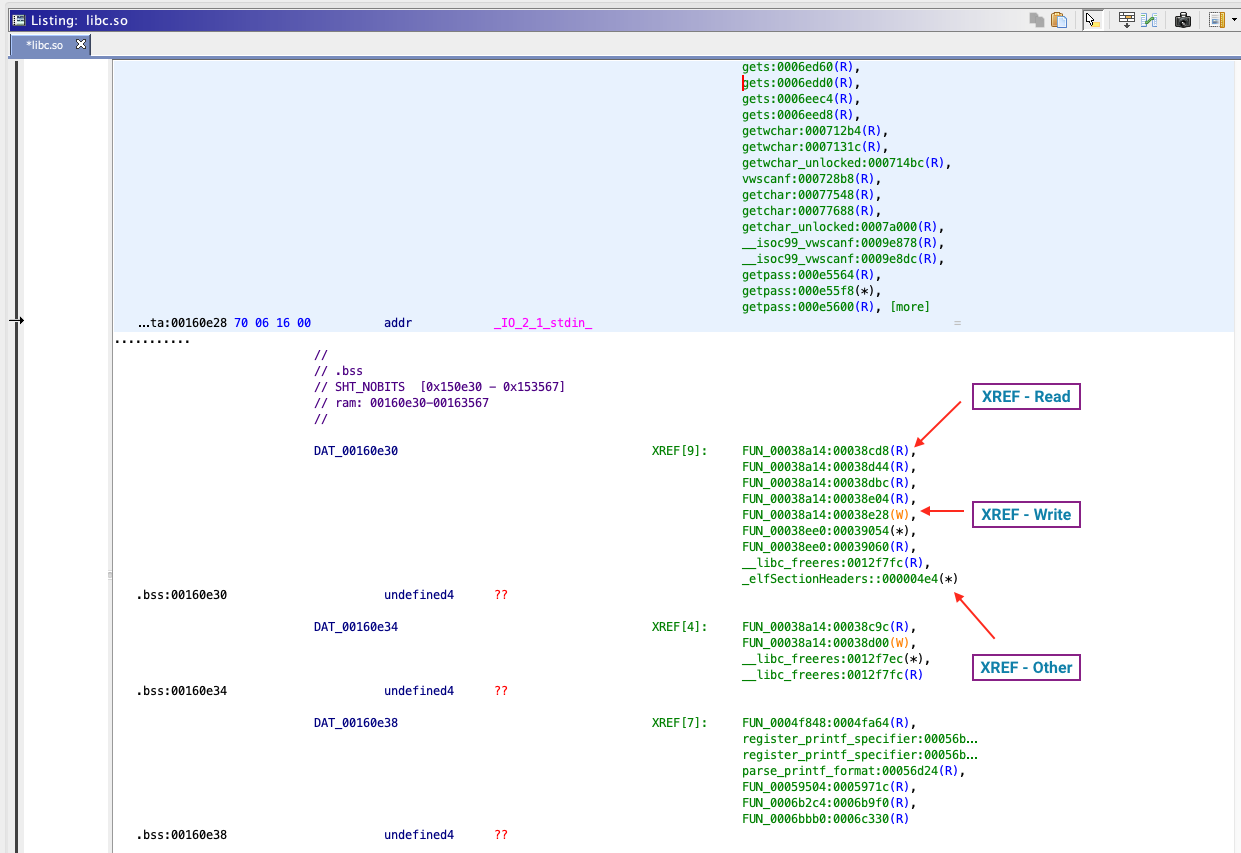
Read Cross Reference - An instruction referencing this memory location as part of a read operation.
Write Cross Reference - An instruction referencing this memory location as part of a write operation.
Other Cross Reference - I’m not entirely sure what qualifies as “other,” but in all instances that I’ve seen, its one data location storing the address of another data location or instruction.
External Cross Reference Resolution
References are internal if they refer to a symbol or address that is within the same binary. It is external otherwise. For example, consider this project which contains two binaries: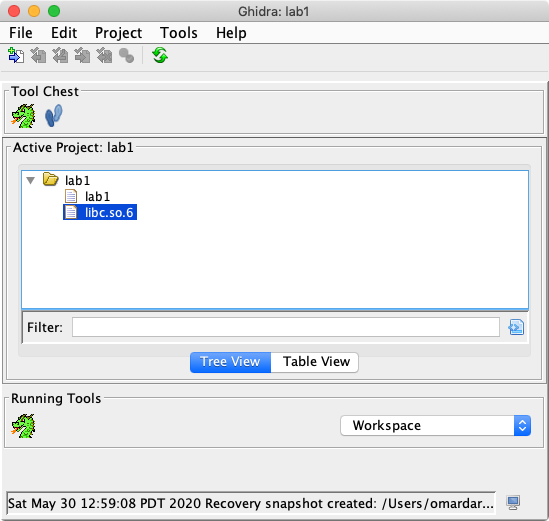
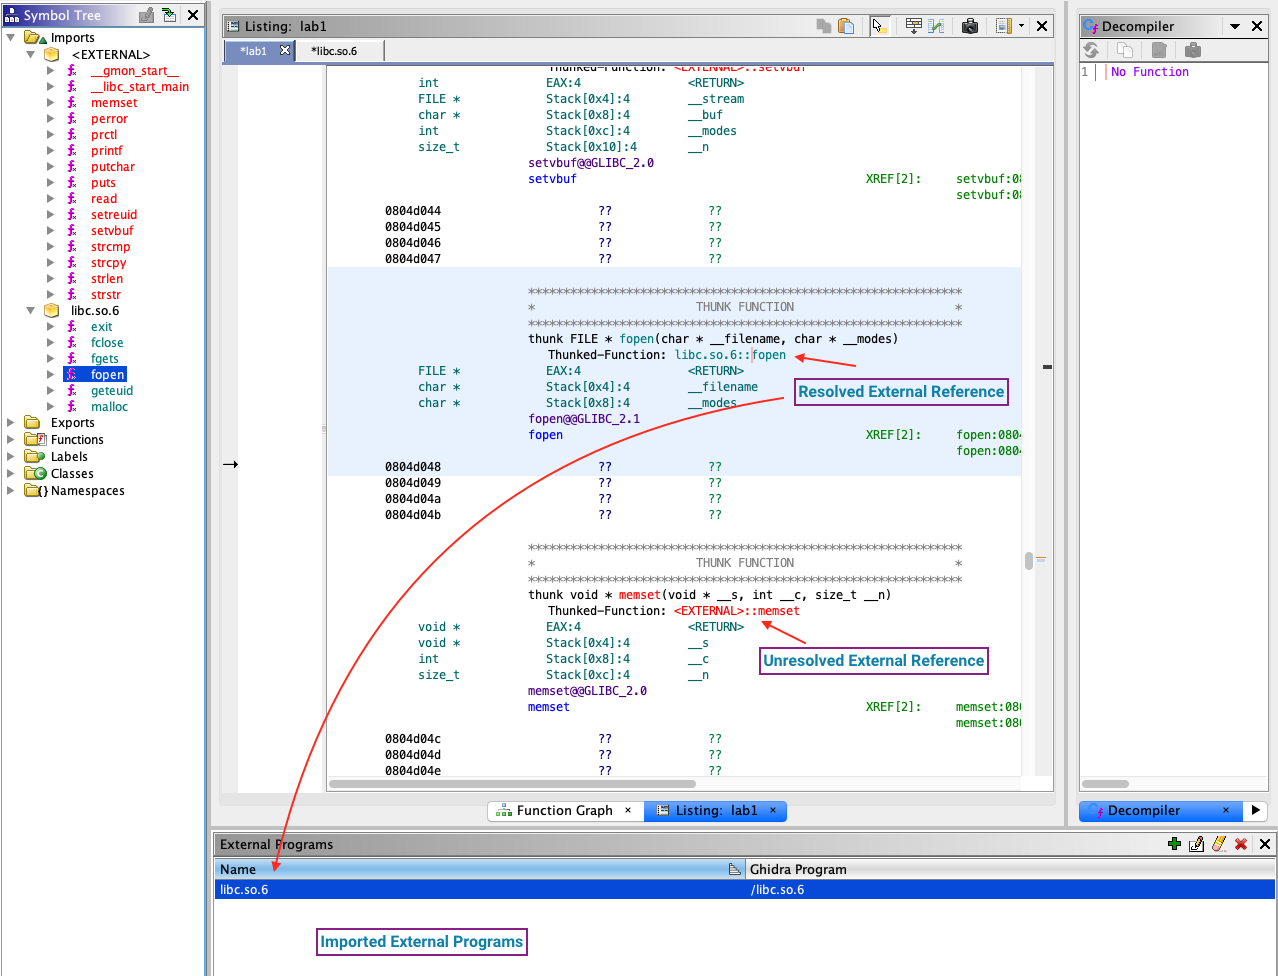
Resolved
Looking at the symbol tree we see that the function fopen has resolved to the fopen symbol found in libc.so.6. Ghidra understands which external binary provides the imported function, and where the binary is stored relative to the project directory. Double clicking on a resolved external symbol will navigate Ghidra to the source binary loaded within the project.
External
External imports that don’t resolve to a loaded binary within the Ghidra project are highlighted in red. Ghidra marks these as thunk functions. It knows that these function addresses will be resolved by the loader at runtime.
Comment Types
Comments add information that otherwise isn’t (or can’t be) expressed by other Ghidra components. In addition to the pre, post, plate, and end-of-line comments described earlier, Ghidra has automatic, repeatable, and referenced-repeatable comments.
Automatic Comments
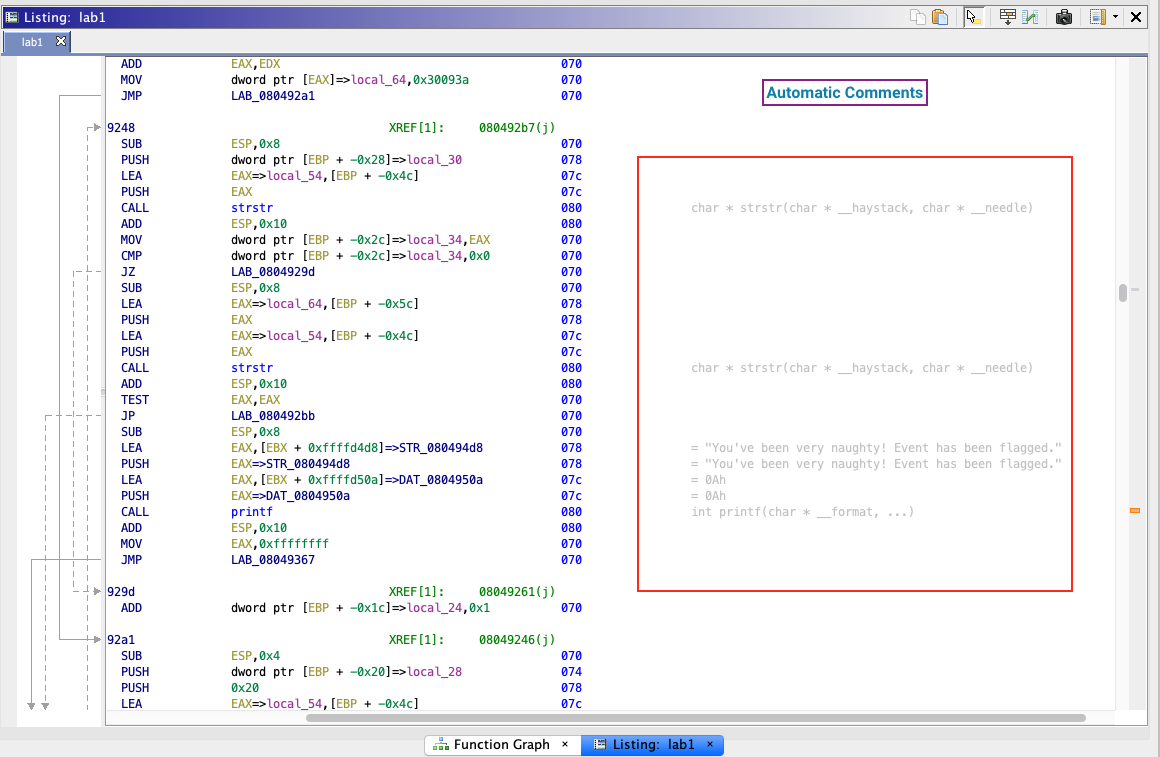
Automatic comments are those added by Ghidra’s analyzers or reference mechanics. For example, if a literal is referenced, its value is shown as a comment. If a function is called, its signature is provided.
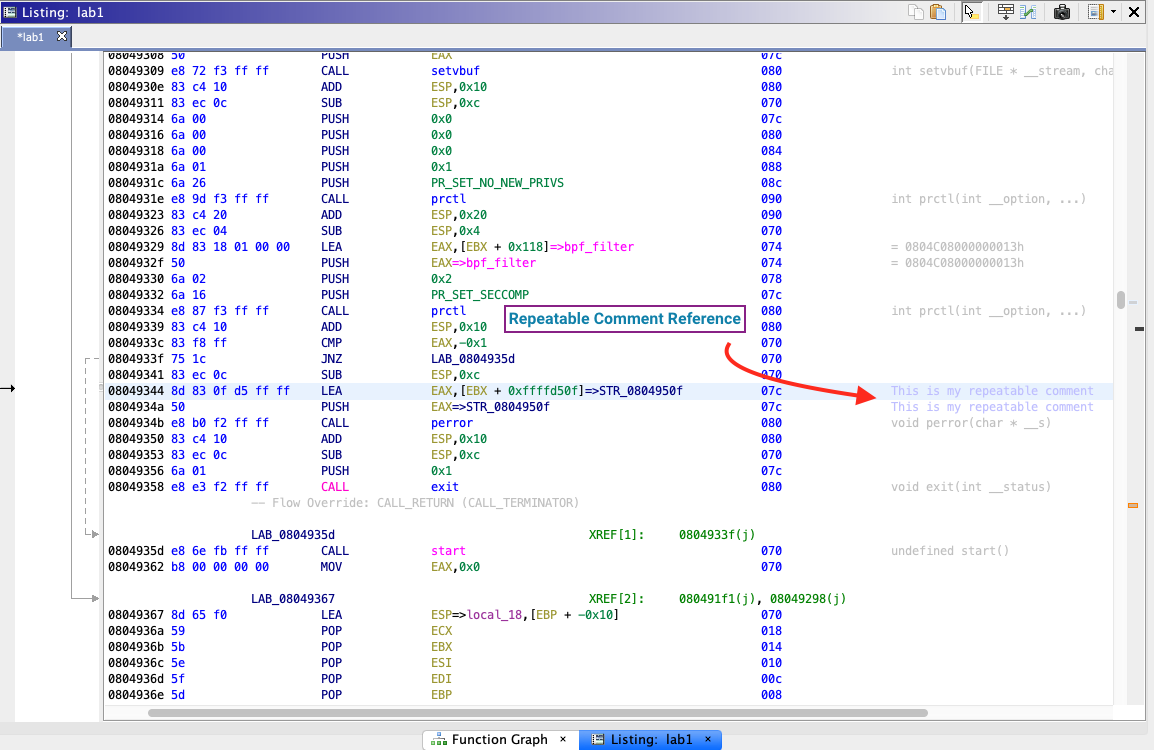
Repeatable Comments
Repeatable comments are meant to “repeat” at cross reference locations. They add useful information at the source, which is then shown anywhere else that address is referenced.
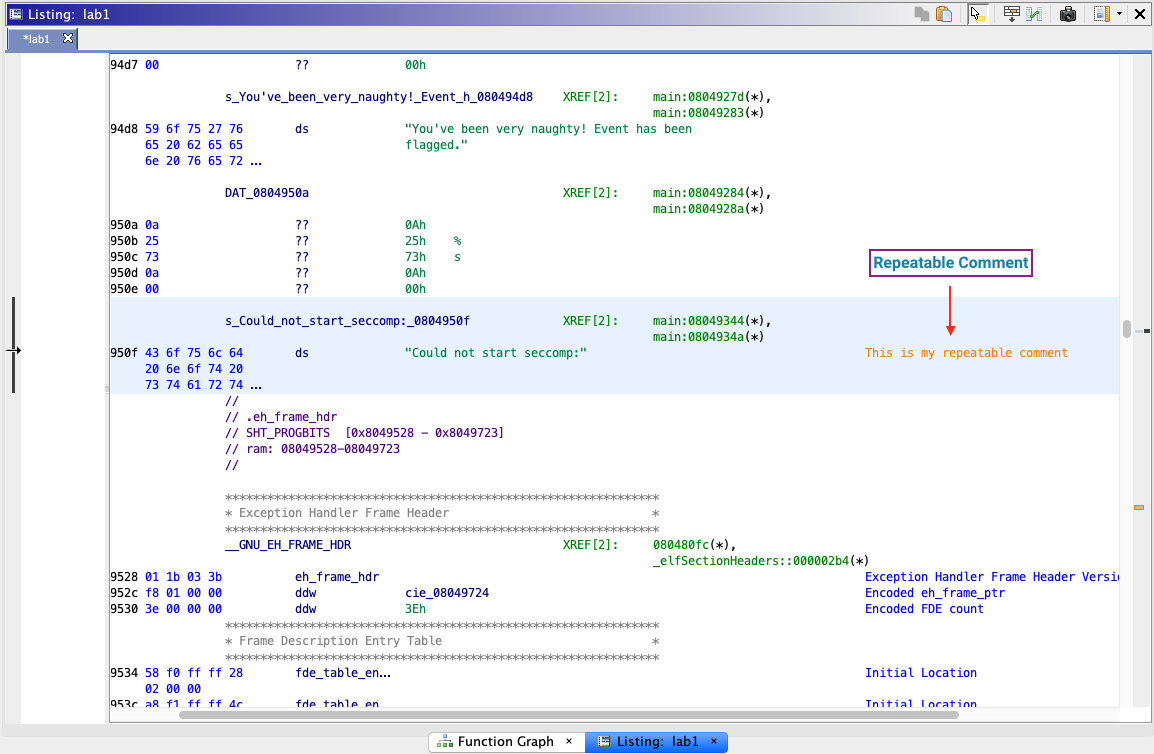
Repeatable comments propagate if two conditions are met:
- The referenced location has a repeatable comment.
- The cross reference location itself does not have end-of-line or repeatable comments.
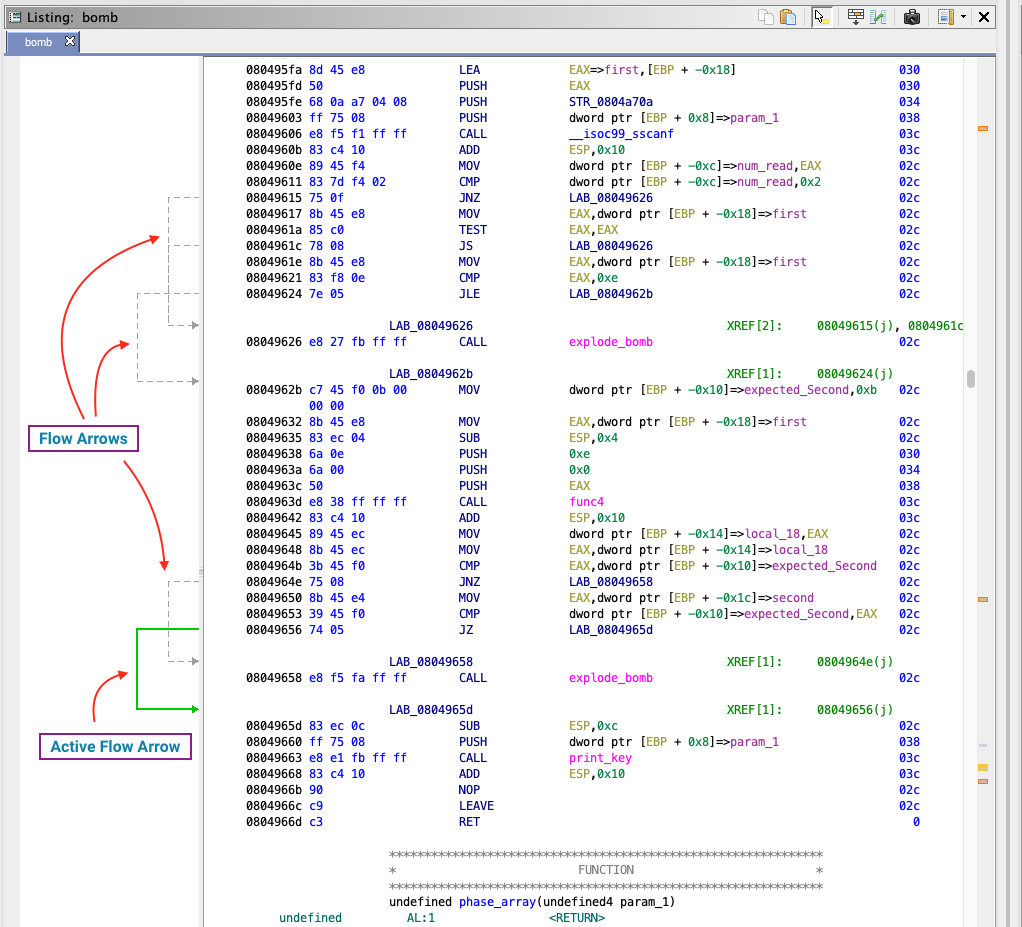
Flow
Like edges in the function graph, the listing view offers flow arrows highlighting execution paths between basic blocks.
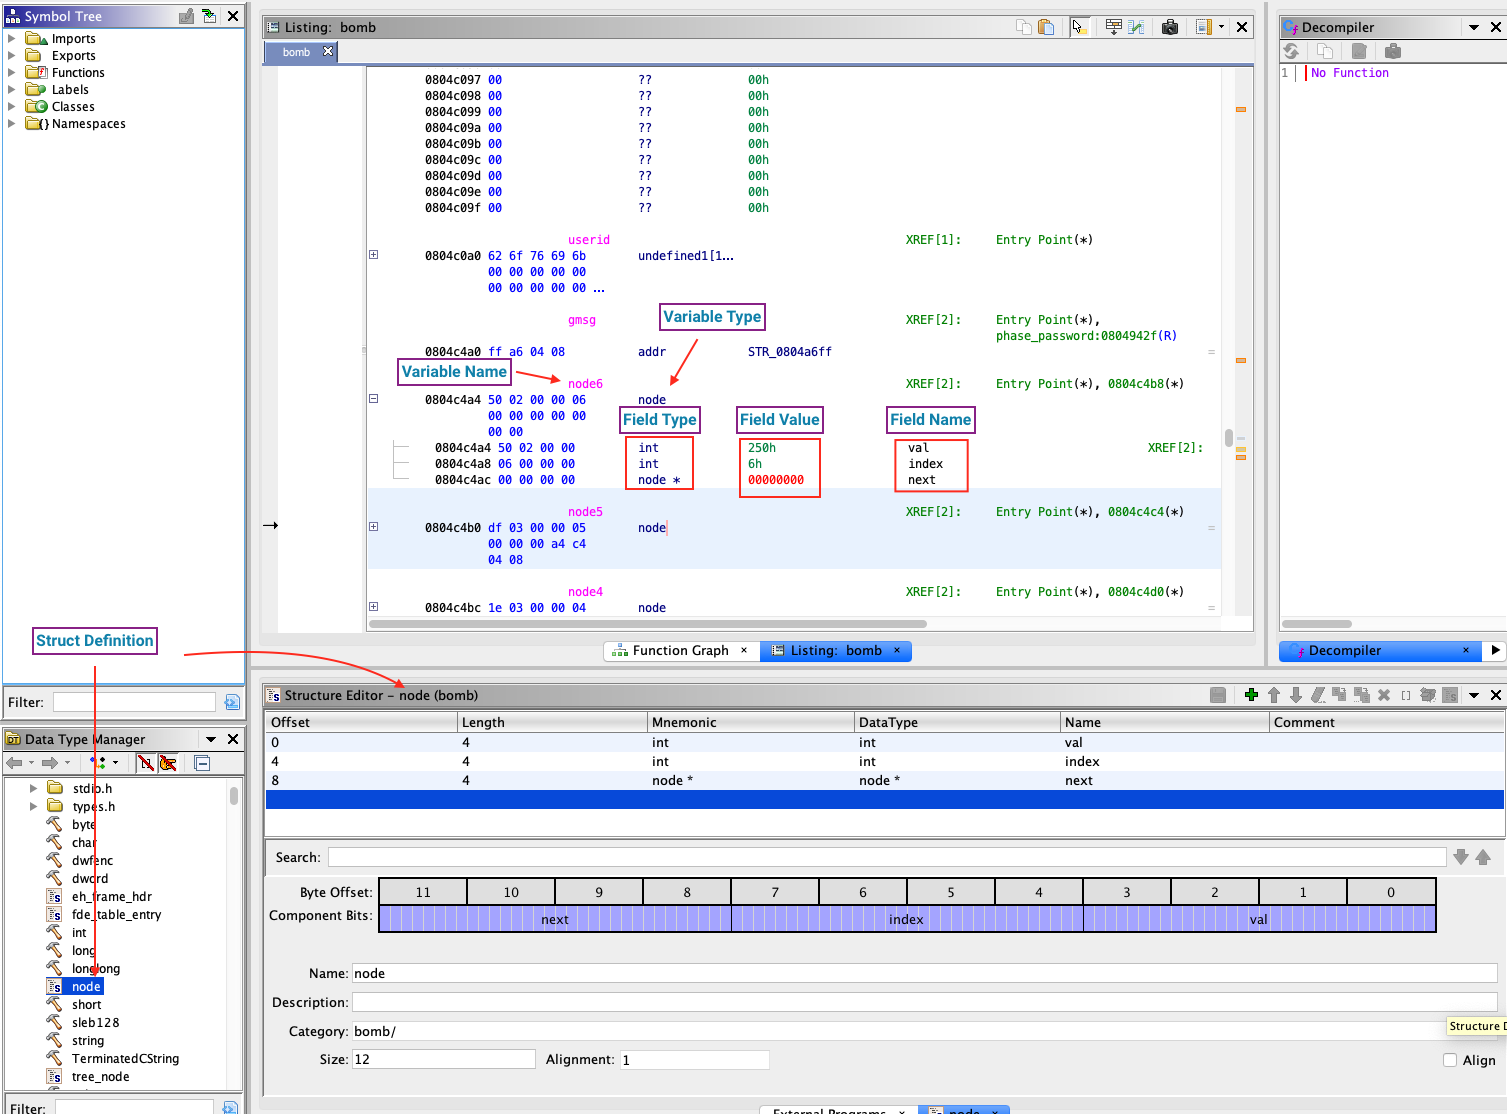
Structs
Ghidra comes with a generic library of common structs. You can also define additional structs to meet your needs. If Ghidra knows about a struct, you can then apply it as a data type to any variable.
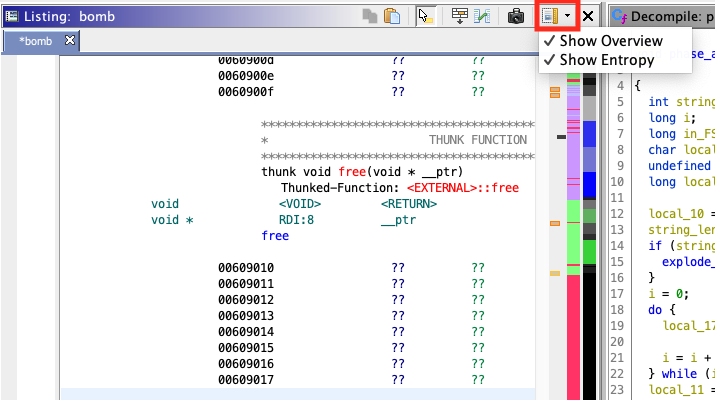
Navigation
Navigation bars can be enabled for the listing view. One is a general overview, and the other highlights entropy fields.
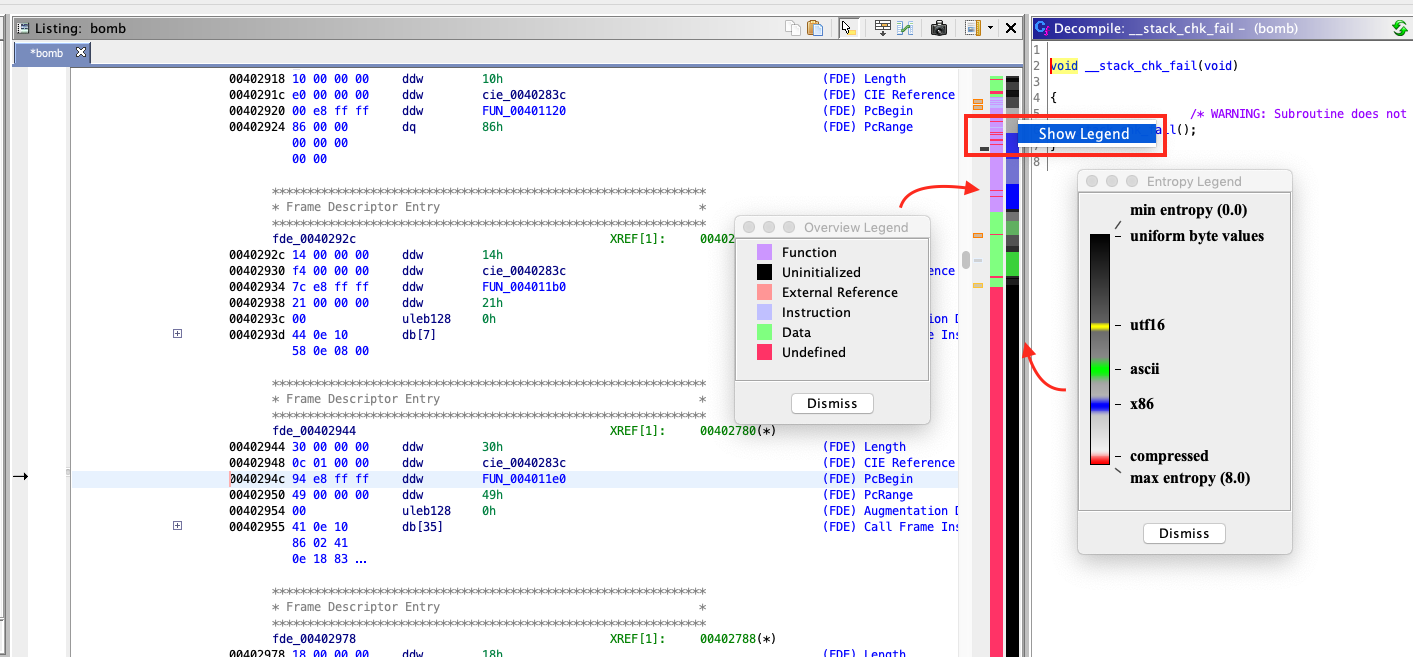
The overview bar gives a high level view of data, references, functions, instructions, and unexplored regions.
Entropy
The entropy bar highlights chunks of identifiable entropy. By default, Ghidra will look for 1024 byte blocks of UTF-16 strings, ASCII strings, x86 instructions, or compressed regions but this is configurable through Edit -> Tool Options -> Entropy.
Decompiler
Ghidra’s decompiler is arguably its best feature. Although not as advanced as IDA’s Decompiler (which sports a $2XXX license), the decompiler provides a best effort decompilation from disassembled instructions into C, regardless of the target binary’s target processor. Of course, the result is not 100% accurate, but in most cases is excellent. When exploring a new function, this is the window I visit first.
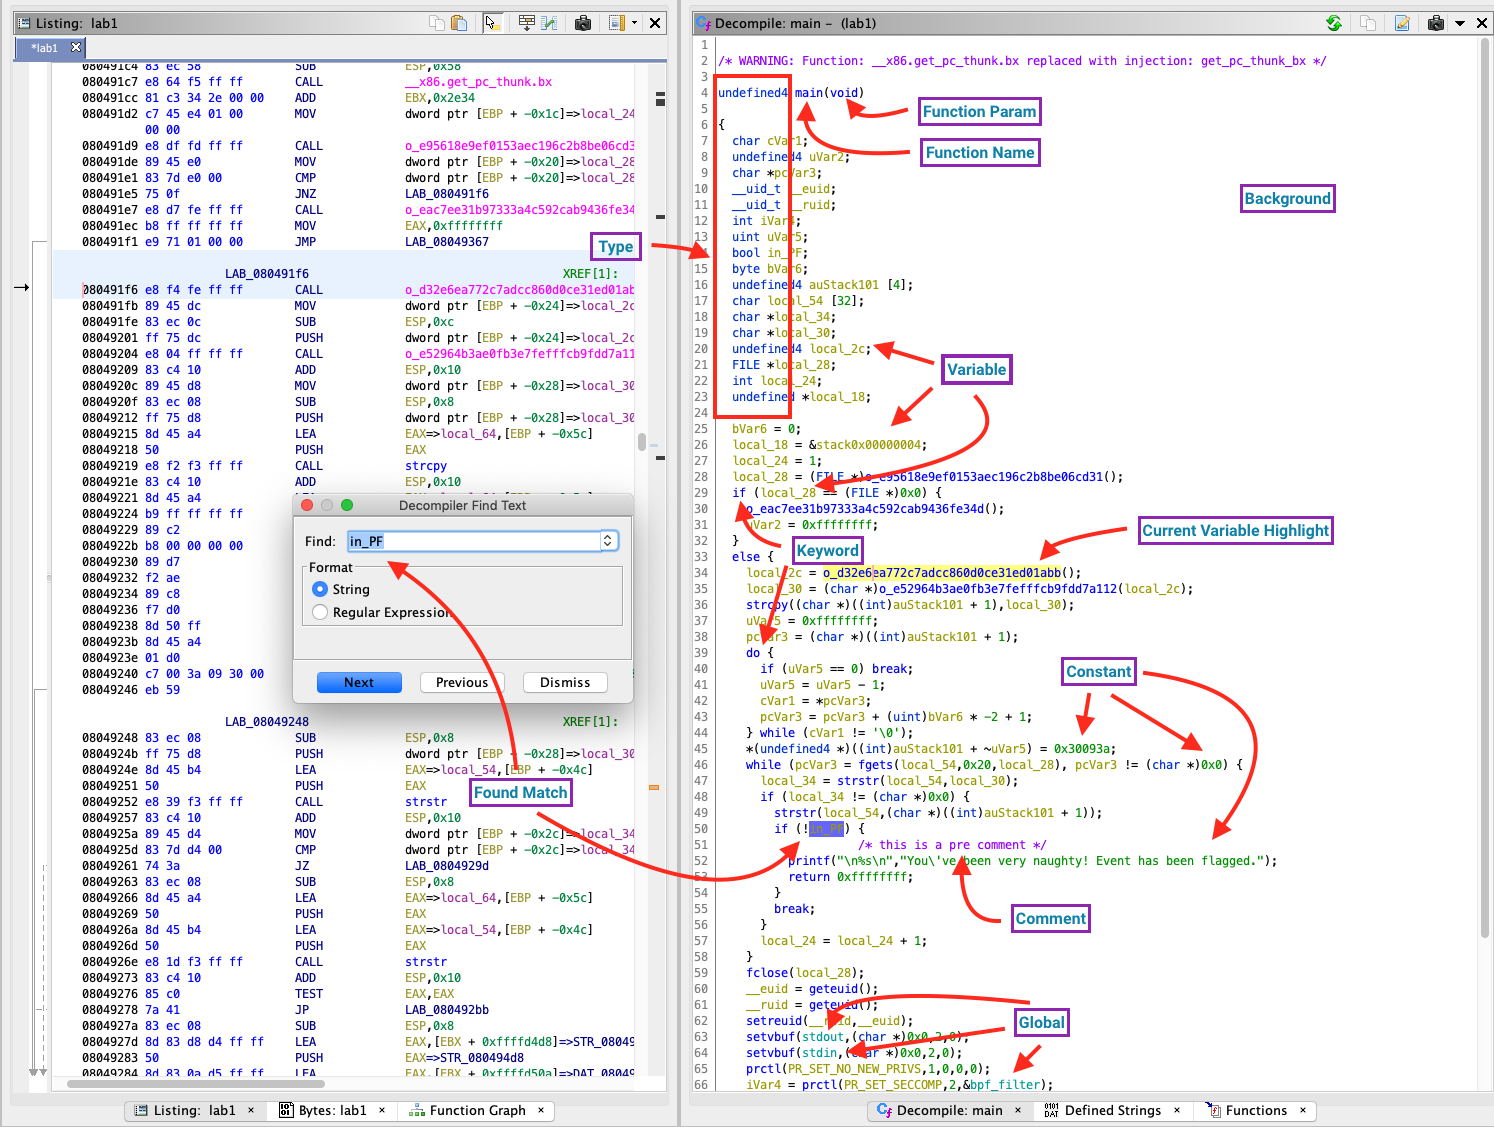
Background - Self explanatory.
Comment - Comments, which either you or Ghidra’s many analyzers can add.
Constants - Literal values like numbers, addresses, and strings.
Current Variable Highlight - Clicking on a variable or using the middle mouse button highlights usage of this variable.
Function Names - Self explanatory.
Function Parameters - Self explanatory.
Variable Names and Types - Self explanatory.
Globals - Variables located in the .data and .bss memory sections (initialized and initialized globally-scoped data).
Matches Found - Search for exact string matches or regular expressions with Ctrl/Cmd-F.
Keywords - Supported C keywords.
Function Graph
If you’re an IDA user who prefers a graphical view as apposed to a listing, Ghidra delivers. Within this mode, disassembly is rendered as a control flow graph. In this graph, basic blocks are vertices connected by execution flow edges. Each edge represents a conditional jump, fallthrough, or unconditional jump.
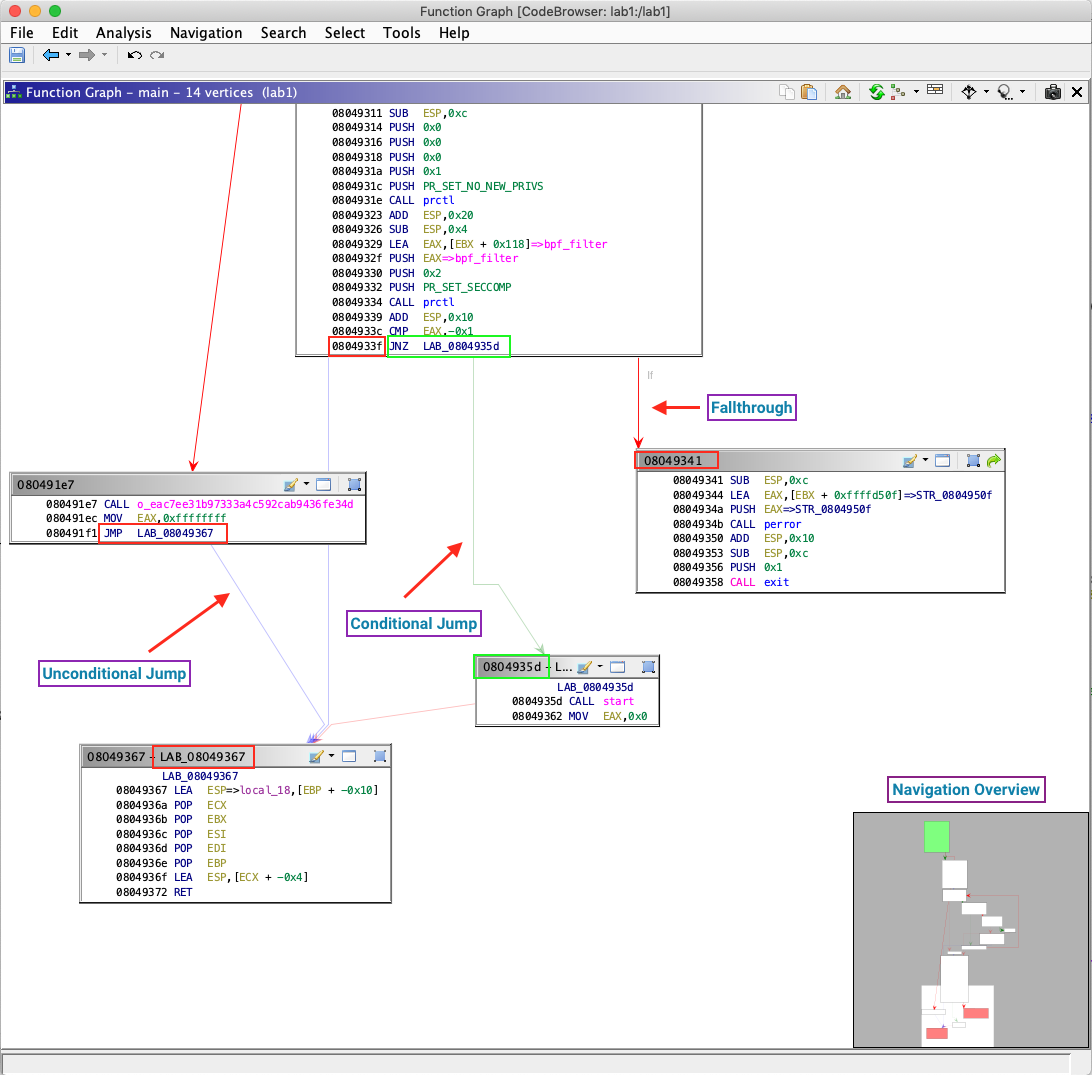
Unconditional Jump - Execution path that will always be taken when the basic block is finished running
Conditional Jump - Execution path taken if the branch condition is met. In the example above, execution will continue at
0x804935dif at0x804933c, registerEAX == -1.Fallthrough - Execution path taken if a branch condition is not met. For the previous example, execution continues at
0x804931if registerEAX != -1at0x804933cNavigation Overview - Like a mini-map, this gives context to where the current graph view fits in with the overall function graph.
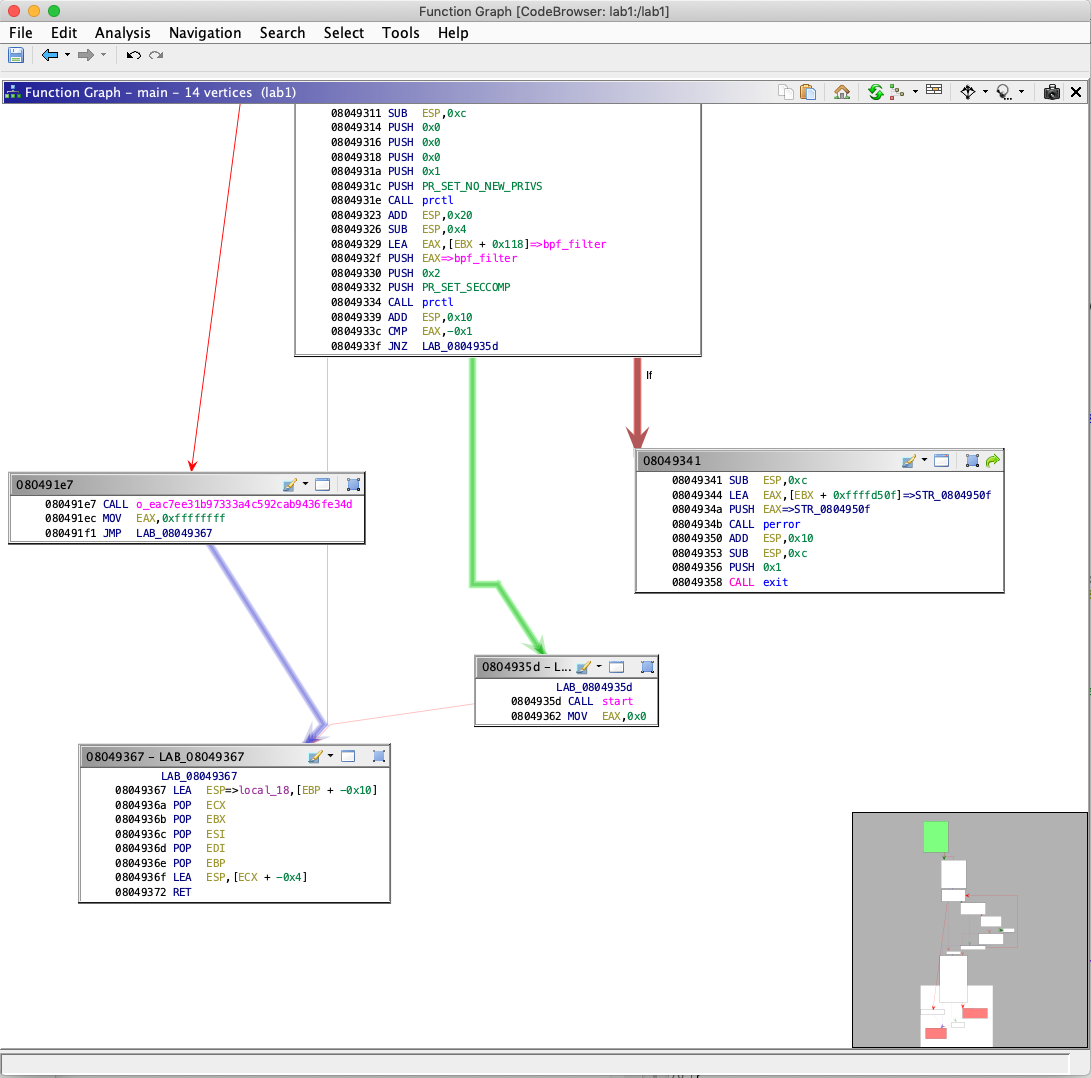
Ghidra also offers vertex grouping to help reduce clutter.
Byte Viewer
This window provides a byte level view of the binary, with minimal decoding and no disassembly. It’s helpful in getting a foothold when analyzing something where the target format is unknown. The default view is a table with three columns: 16 bytes (hex decoded), the address of the first byte in that row, and ASCII decoding for each byte. Ghidra offers options to customize coloring for most of this window’s elements, which I’ve labeled below. These options are found under Edit -> Tool Options -> Byte Viewer
Normal Mode
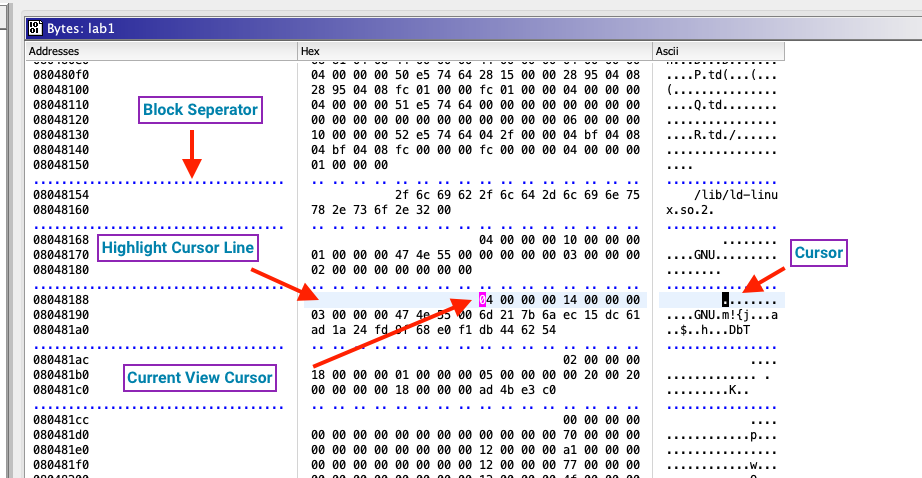
Block Separator - Separator marking boundaries between memory segments. These segments represent the runtime memory view. Ghidra provides more detail in Window -> Memory Map.
Current View Cursor - Cursor in the last-clicked column, when the byte viewer window has focus.
Cursor - Cursor in all other inactive columns.
Highlight Cursor Line - Current cursor line is highlighted in this color.
Edit Mode
An edit mode is also provided, where bytes can be overwritten.
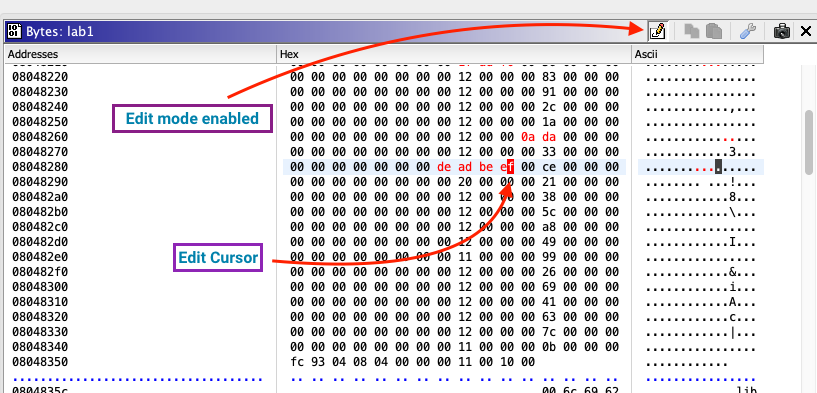
To begin editing, toggle edit mode with the edit mode button at the top of the window. Click on a byte to begin editing. Edited bytes which have not been saved are highlighted in red.
Dive in
This was a quick paced introduction shiniest features of Ghidra. It should be enough to start looking at binaries of interest, but by no means is this a complete reference. There’s still plenty of incredibly useful features and plugins to aid your reverse engineering adventure.
If you’ve got an interesting workflow or an underrated feature you’d like to share, Tweet me @byte_how. I’d love to learn! Comments, concerns, corrections, commendations, are all appreciated 😊
